Latest changes on emta.com
Financing/Pricing data
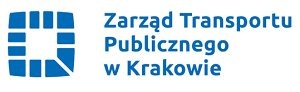
Budget 2019: HSL’s operating income is 748,2 million euros, of which ticket revenue accounts for 51,2 percent and municipal contributions for 46,5 percent. The operating expenses are 735,3 million euros, of which public transport operating costs account for 70 percent. Fares & Tickets In the integrated Helsinki metropolitan area ticketing area, there are city internal
Public transport networks
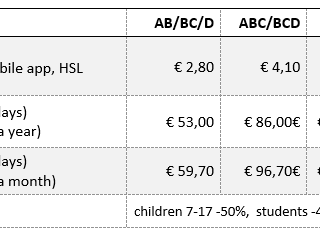
Public Transport System The heterogeneity of the association area is reflected by the structure of public transport network. The polycentric settlement structure determines a number of traffic-related links. Within the urban agglomeration Rhein-Main regional traffic is accessed by the well-developed S-Bahn network. Local access functions are guaranteed by an adapted secondary network (subway, trams and
Identification of metropolitan area
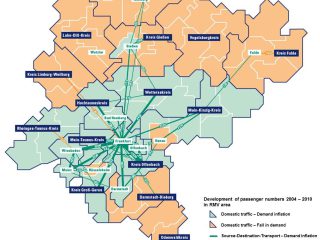
Description of metropolitan area Rhein-Main-Verkehrsverbund (Rhine/Main Regional Transport Association or RMV) is one of the biggest transport associations in Germany. It coordinates and organises regional bus and rail transport services across an area of around 14,000 square kilometres. That’s around two-thirds of the area of the Federal State of Hesse. There are approximately 5 million
Financing/Pricing data
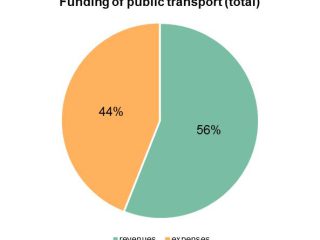
Funding of public transport Fare revenues are the basis for the funding of RMV and its transport services. In 2014 approximately 56% of expenses are covered by revenues while 44% are government-financed. The public transport service costs prorate approximately to 48% on regional rail transport, to 5% on regional bus transport and to 48% on
Public transport system
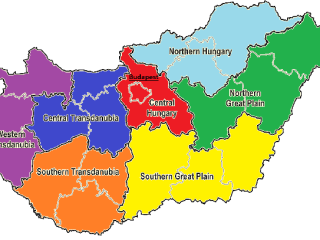
Description of the network Public transport appeared in the Hungarian capital city, Budapest, in the early 19th century in the form of the omnibus and later the horse tramway. These were followed by means of transport that were revolutionary in those times: Europe’s second funicular connected the Castle Hill with the Danube riverbank while the
Identification of metropolitan area
Budapest is the capital and the largest city of Hungary, which also means that it is the country’s principal political, cultural, commercial, industrial and transportation centre. Budapest became a single city occupying both banks of the river Danube with the unification in 1873 of west-bank Buda and Óbuda with east-bank Pest. Budapest has 1.74 million
Identification of the metropolitan area
The Bucharest-llfov region is the area with the highest population density in Romania, with a population of 2,272,163 inhabitants (according to the 2011 Census) and a density of 1,248 inhabitants per km². Bucharest has a total population of 1,883,425 inhabitants and a total area of 228 km², at a density of 8,260 inhabitants per km².
Public transport networks
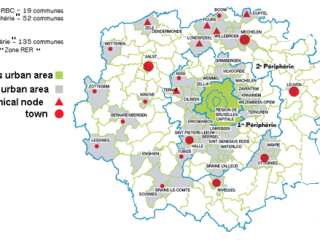
Public Transport System Description of the network: Local company (STIB): underground tramways bus Regional companies: TEC (Walloon Region) and DE LIJN (Flemish Region): only bus Railways (SNCB): owned by federal State; 95% of passengers lines of SNCB goes trough Brussels Urban Buses Suburban buses Tramways Metro Heavy Rail Nb of lines 50 +/- 50
Identification of metropolitan area
Brussels Capital Region is one of the three Belgian Regions. It is divided into 19 communes. It has about 1.2 million inhabitants, out of a total Belgian population of about 12 million. Brussels Capital Region is administered by a Parliament and a Regional Government composed of 89 elected members. Brussels Mobility is one of the
Public transport networks
Public Transport System Description of the network: In 2015/16, 325.8 million public transport journeys were made in the West Midlands Metropolitan Area (267.1 million bus passenger journeys, 53.7 million rail passenger journeys and 5.0 million metro passenger journeys). Bus: 96% of bus service kilometres in the West Midlands are operated on a commercial basis by
EMTA Members